Dennis Riccio | West USA Realty | Rim Country Real Estate Specialist
Payson Arizona | July 1 through September 30 2026
By Dennis Riccio, JD, MBA, REALTOR® with West USA Realty
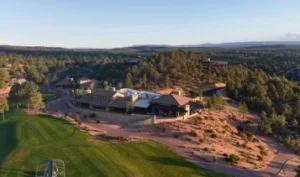
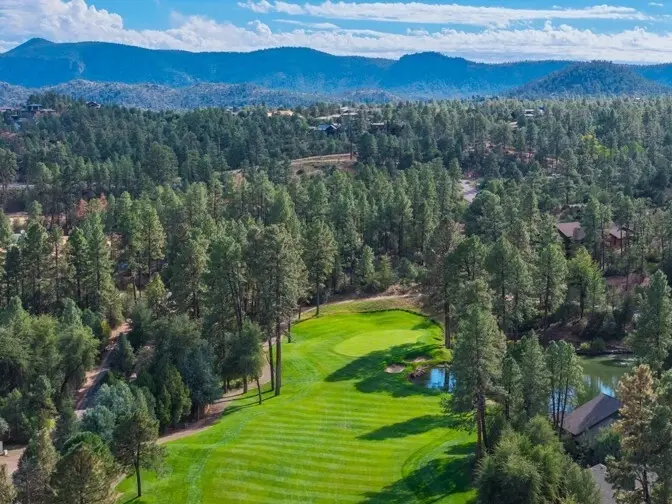
Golf course and wooded surroundings in Chaparral Pines in Payson Arizona
Higher quarterly prices with substantial buyer choice
The Chaparral Pines real estate market finished the third quarter of 2026 with fewer home sales than a year earlier, a higher median sale price and shorter marketing times for the homes that closed. At the same time, September inventory remained substantial, and the year-to-date median sale price was below 2025.
For buyers and sellers, those results make property-level comparisons essential. A golf-course setting, floor plan, condition, view and asking price can matter more than the change in a small community-wide median. This report examines closed home sales, available inventory, homesites and ownership costs in Chaparral Pines through September 30, with a separate October 2 snapshot of current listings.
Chaparral Pines home sales in Q3 2026
| Residential metric | Q3 2025 | Q3 2026 | Change |
|---|---|---|---|
| Closed sales | 12 | 10 | −16.7% |
| Median sale price | $936,000 | $1,187,500 | +26.9% |
| Average sale price | $1,119,383 | $1,237,550 | +10.6% |
| Sales volume | $13,432,600 | $12,375,500 | −7.9% |
| Average days on market | 182 | 101 | −44.7% |
| Median days on market | 126 | 103 | −18.7% |
| Average sale to final list price | 93.3% | 97.4% | +4.2 points |

Source Central Arizona MLS residential transactions closed July through September in each year
The ten homes sold during Q3 2026 ranged from $561,000 to $2,135,000. Six sold for at least $1 million, compared with four of twelve during Q3 2025. The greater share of million-dollar transactions helps explain the higher quarterly median.
The median home size was approximately 3,008 square feet in Q3 2026, compared with 3,191 square feet a year earlier. The price increase therefore cannot simply be attributed to larger homes. Differences in condition, setting, features and the particular properties sold still matter. These are different groups of homes, rather than repeat sales measuring appreciation of the same properties.
Inventory and pricing competition
The September Market Summary reported 37 active residential listings, compared with 38 in September 2025. Its absorption measure was 8.22 months, versus 8.00 months a year earlier. That measure suggests substantial supply relative to the sales pace used by the MLS; it is not a forecast of how long a particular home will take to sell.

Monthly MLS summary counts for January through September 2026
During Q3 2026, the monthly summaries recorded 12 new listings, ten pended listings and ten closings. The same months in 2025 recorded 21 new listings, 16 pended listings and twelve closings. Pended listings count activity during the period and should not be confused with the number currently under contract.
Current listings as of October 2
The detailed October 2 export contained 35 active homes and four pending listings. Active asking prices ranged from $699,000 to $4,370,000, with a median of $997,000. Twenty of the 35 active homes, approximately 57%, were priced below their original asking price on the current listing record.
This current snapshot differs from the September summary because the dates and reporting methods differ. The 37 September active listings are used for quarter-end context; the 35 October 2 listings are used for the current price-reduction analysis. Original-price comparisons do not capture every price change across earlier relistings.
Negotiation also depends on which asking price is used. Q3 2026 homes sold for an average of 97.4% of their final list price but 92.9% of their original list price. A sale close to the final asking price can still follow earlier reductions.
The year to date view adds context
| Residential metric through September 30 | 2025 | 2026 |
|---|---|---|
| Homes sold | 36 | 35 |
| Median sale price | $1,002,500 | $895,000 |
| Average sale price | $1,135,244 | $1,064,875 |
| Median home size | 3,325 sq ft | 2,866 sq ft |
| Median sold price per square foot | $356 | $348 |
| Average days on market | 133 | 124 |
Year-to-date closings were nearly unchanged, while the median sale price declined 10.7% and the average declined 6.2%. The median size of homes sold was about 13.8% smaller. Median sold price per square foot declined approximately 2.4%. These measures suggest that the changing mix of homes sold contributed to the lower year-to-date median, although they do not isolate the effect of market conditions.

Homes and wooded streets in Chaparral Pines in Payson Arizona
What sellers should take from the numbers
A higher Q3 median is not a reason to increase an individual home’s asking price without comparable sales. Sellers should compare nearby homes with similar layouts, views, age and condition, then account for the properties buyers can choose today. With more than half of current listings below their original asking price, realistic initial pricing deserves attention.
Presentation matters as well. Completing small repairs, documenting improvements and making the home easy to evaluate can reduce reasons for a buyer to postpone a decision. If showings are not producing offers, revisit both price and property-specific feedback rather than relying on the community median.
Buying a home in Chaparral Pines
Buyers have meaningful choices, but the homes that sold in Q3 moved faster on average than those sold a year earlier. Substantial inventory does not establish that every seller will accept the same discount. Compare the home’s current price and listing history with recent sales, and assess concessions separately from the recorded sale price.
For a retirement residence or second home, consider how the property will work when you are using it and when you are away. Interior steps, garage access, outdoor upkeep, deck exposure, storage and the cost of maintaining the property can change which home is the best fit. A course view and a forest setting offer different tradeoffs that a community-wide price statistic cannot resolve.

Interior living space in a Chaparral Pines home
Chaparral Pines land and homesite market
| Homesite metric | Q3 2025 | Q3 2026 |
|---|---|---|
| Lots sold | 6 | 6 |
| Total sales volume | $433,950 | $459,000 |
| Average sale price | $72,325 | $76,500 |
| Average days on market as displayed by MLS | 312 | 135 |
Homesite sales were unchanged, with average prices approximately 5.8% higher. The 2026 transaction export shows a Q3 median lot sale price of $75,000. With only six sales per quarter, individual lot characteristics can strongly affect these results.
The October 2 land export contained thirteen active lots and two pending listings. Before choosing a homesite, evaluate slope, access, utilities, the building envelope and applicable design requirements. The purchase price is only one part of the cost of completing a home.
HOA dues and club membership costs
Ownership expenses belong in the comparison alongside the purchase price. Based on the figures supplied for this report, Chaparral Pines HOA dues are $585 per quarter, or $2,340 annually. The minimum Trailhead/Sport membership buy-in is now $10,000. HOA dues and club membership charges are separate expenses.

Courts at Chaparral Pines illustrate amenities buyers may consider when reviewing membership options
Club membership pricing is changing. The earlier membership flyer is background information, and its other initiation fees and monthly dues are not presented here as current rates. Buyers should obtain the current schedule directly from the club and confirm required membership, ongoing dues, taxes, additional charges, transfer terms and which amenities or golf privileges are included.